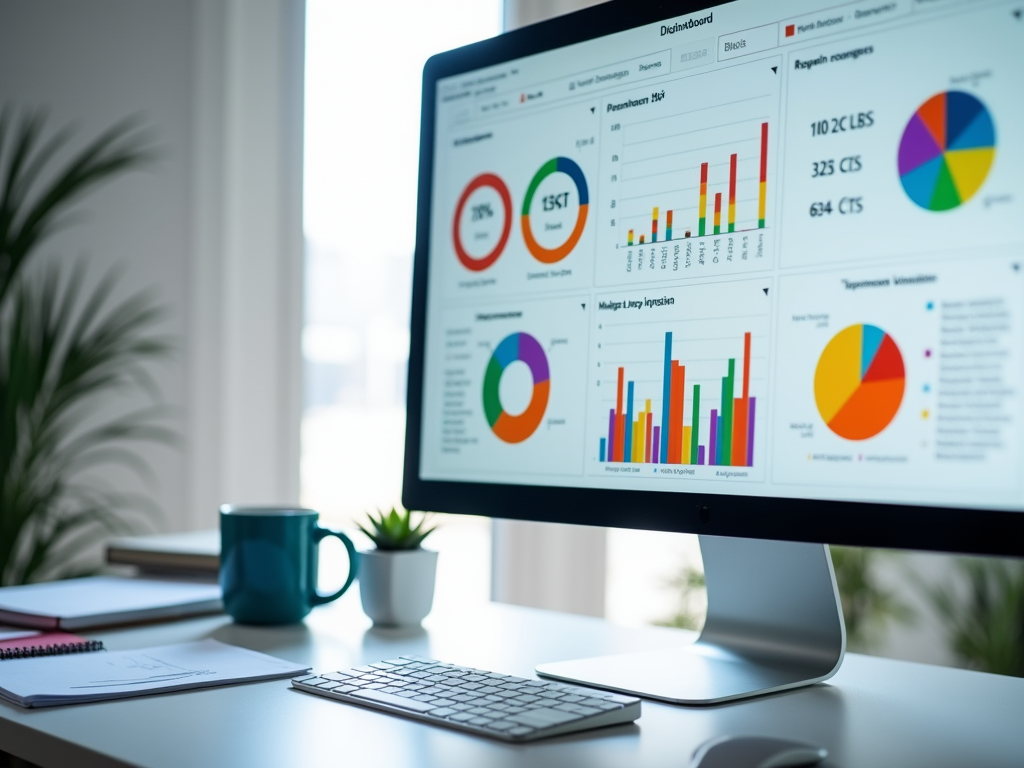
In the fast-paced world of digital marketing, understanding your performance indicators is not just beneficial; it’s essential. With vast amounts of data generated by online campaigns, interpreting this information effectively can be the difference between success and failure. By utilizing KPI dashboards, marketers can visualize their performance metrics in a cohesive manner that guides strategic decision-making. These dashboards transform raw data into actionable insights, allowing brands to adapt their marketing strategies dynamically. Whether you’re a seasoned marketer or just starting out, mastering the use of KPI dashboards can elevate your marketing efforts exponentially. Let’s delve into the importance of these powerful tools.
What is a KPI Dashboard?

A KPI (Key Performance Indicator) dashboard consolidates critical metrics into one visual representation. It serves as a snapshot of your marketing performance, helping you to track your objectives and make informed decisions. By organizing various KPIs into a singular interface, these dashboards offer valuable insights at a glance. This can significantly streamline the process of monitoring campaign effectiveness, brand engagement, and overall return on investment (ROI). Additionally, the ability to customize and tailor dashboards to specific needs makes them an invaluable resource for many marketing teams. In an era where data is king, utilizing KPI dashboards becomes a non-negotiable aspect of effective marketing management.
- Metrics and KPIs: These measure the success of your marketing strategies and help align them with your business objectives.
- Visual Elements: Common charts and graphs make data easy to interpret, turning overwhelming numbers into clear visuals.
- Interactivity: Features such as drill-down capabilities enhance user engagement and data exploration.
The Importance of KPI Dashboards in Marketing

Understanding the significance of KPI dashboards is crucial for marketers aiming to optimize their campaigns. These tools provide a wealth of benefits that directly impact performance. Firstly, they enable real-time monitoring, ensuring that marketers can stay agile and responsive to changing circumstances. Secondly, data visualization simplifies complex data, allowing teams to grasp trends and insights swiftly. Furthermore, KPI dashboards facilitate performance benchmarking against historical data and industry standards. This benchmarking not only highlights areas for improvement but can also celebrate ongoing successes within the marketing strategy.
- Data Visualization: Helps in presenting intricate details in an easier-to-understand format.
- Real-Time Monitoring: Provides up-to-date information, enabling prompt decision-making.
- Performance Benchmarking: Allows for evaluation of current performance against past results and industry norms.
| Metric | Description | Purpose |
|---|---|---|
| Conversion Rate | Percentage of visitors who complete a desired action. | Measures effectiveness of a marketing campaign. |
| Customer Acquisition Cost | Cost associated with acquiring a new customer. | Helps in budgeting marketing efforts. |
| Return on Investment | Measure of profitability for marketing efforts. | Indicates overall efficiency of marketing campaigns. |
How to Create an Effective Marketing KPI Dashboard
Creating a KPI dashboard requires careful planning and execution. The first step is to define your goals clearly, ensuring they align with your overall business objectives. Once your goals are established, the next step is to select relevant KPIs. These should reflect the specific areas of your marketing strategies that you want to monitor closely. After that, you need to choose the right dashboard tools—there are many platforms available that can help bring your data visualization to life. Designing a user-friendly layout will significantly enhance the dashboard’s effectiveness, ensuring that team members can access and interpret data effortlessly. Finally, implementation and testing are crucial; after launching the dashboard, make necessary adjustments based on user feedback and performance observation.
- Define Your Goals: Establish clear, measurable marketing objectives.
- Select Relevant KPIs: Identify key metrics that align with the goals.
- Choose Dashboard Tools: Look into platforms that offer functionality you require.
- Design the Layout: Create an intuitive interface for ease of use.
- Implement and Test: Roll out the dashboard and refine based on feedback.
Best Practices for Using KPI Dashboards
To maximize the effectiveness of KPI dashboards, adhering to certain best practices is essential. Keeping your dashboard updated regularly ensures that the data remains relevant and informative. It is important to focus on actionable insights—this means prioritizing the metrics that influence decision-making effectively. Additionally, encouraging team collaboration is vital; sharing insights within your marketing team fosters a culture of transparency and innovation. Regular reviews of the dashboard can also help in adjusting strategies as needed, keeping the team agile and responsive to changes in the market landscape.
- Regular Updates: Schedule frequent data refreshing to maintain accuracy.
- Focus on Actionable Insights: Prioritize metrics that can drive tangible decisions.
- Encourage Team Collaboration: Promote a culture of shared insights and strategies.
Conclusion
Incorporating KPI dashboards into marketing strategies enhances the ability to track progress and optimize performance. With clear metrics and benchmarks, marketers can ensure they are moving in the right direction. These visual tools are more than just data collectors; they empower teams to understand their successes and identify areas for improvement. By staying aligned with clear goals and continuously optimizing their dashboard, marketers can significantly boost their efforts in today’s competitive landscape. Ultimately, harnessing the power of KPI dashboards is not merely a trend; it is a fundamental need for those looking to thrive in the digital marketing space.
Frequently Asked Questions
- What is a KPI dashboard? A KPI dashboard is a visual representation of key performance indicators used to track business objectives.
- Why are KPI dashboards important in marketing? They provide real-time insights, facilitate data-driven decisions, and help measure the effectiveness of marketing strategies.
- How do I create a KPI dashboard? Define your goals, select relevant KPIs, choose the right tools, and design an intuitive layout for users.
- What tools can I use for creating a KPI dashboard? Popular tools include Google Data Studio, Tableau, and Microsoft Power BI, among others.
- How often should I update my KPI dashboard? It’s recommended to update the dashboard regularly, ideally in real-time or at least daily, to maintain accuracy.